The following is a simple tutorial for using random forests in Python to predict whether or not a person survived the sinking of the Titanic. The data for this tutorial is taken from Kaggle, which hosts various data science competitions.
RANDOM FORESTS:
For a good description of what Random Forests are, I suggest going to the wikipedia page, or clicking this link. Basically, from my understanding, Random Forests algorithms construct many decision trees during training time and use them to output the class (in this case 0 or 1, corresponding to whether the person survived or not) that the decision trees most frequently predicted. So clearly in order to understand Random Forests, we need to go deeper and look at decision trees.
Decision Trees:
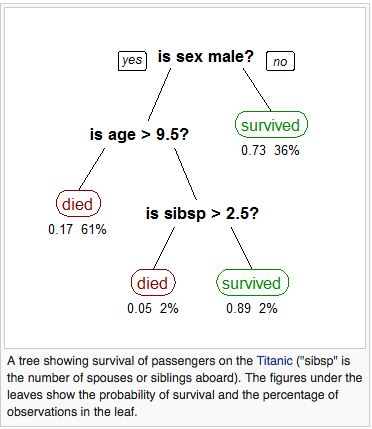
Like most data mining techniques, the goal is to predict the value of a target variable (Survival) based on several input values. As shown below, each interior node of the tree is one of the input variables. How many edges come off each node tell you the possible values for that input variable. So when you are making a prediction, you simply must take an observation, and move your way down the tree until you come to a leaf, and this will tell you the prediction for this decision tree.

As you might be able to imagine, a single decision tree is grown very deep may learn very irregular patterns, and end up overfitting the training data. Thus making it a poor predictor when faced with new data. So what Random Forests do is use a bagging technique, where it builds multiple decision trees by repeatedly resampling training data with replacement. Thus we end up with multiple different decision trees based from the same data set. To predict, we can then run each observation through each tree and see what the overall ‘consensus’ is. In the next section, we are going to implement this algorithm.
BACK TO THE TITANIC:
Below are the descriptions for all the variables included in the data set:
VARIABLE DESCRIPTIONS
survival        Survival
                (0 = No; 1 = Yes)
pclass          Passenger Class
                (1 = 1st; 2 = 2nd; 3 = 3rd)
name            Name
sex             Sex
age             Age
sibsp           Number of Siblings/Spouses Aboard
parch           Number of Parents/Children Aboard
ticket          Ticket Number
fare            Passenger Fare
cabin           Cabin
embarked        Port of Embarkation
First things first, let’s load in the data and take a look at the first few rows using pandas.
import pandas as pd
training = pd.read_csv("train.csv")
# the following will print out the first 5 observations
print(training.head())
Looking at the head of data, it is clear that we are going to need to clean the data up a little bit. Also, we have a number of missing values, which I will simply replace with the median of the respective feature (there are of course better more in depth ways of doing this). Also, since each variable is going to end up being a ‘node’ in a decision tree, it is clear that our dataset must consist solely of numerical values. I do this for Sex, and Embarked. The code is displayed below, it will take either the training or test data set and clean it so it is ready for use by the Random Forest algorithm:
def clean_titanic(titanic, train):
# fill in missing age and fare values with their medians
titanic["Age"] = titanic["Age"].fillna(titanic["Age"].median())
titanic["Fare"] = titanic["Fare"].fillna(titanic["Fare"].median())
# make male = 0 and female = 1
titanic.loc[titanic["Sex"] == "male", "Sex"] = 0
titanic.loc[titanic["Sex"] == "female", "Sex"] = 1
# turn embarked into numerical classes
titanic["Embarked"] = titanic["Embarked"].fillna("S")
titanic.loc[titanic["Embarked"] == 'S', "Embarked"] = 0
titanic.loc[titanic["Embarked"] == "C", "Embarked"] = 1
titanic.loc[titanic["Embarked"] == "Q", "Embarked"] = 2
if train == True:
clean_data = ['Survived', 'Pclass', 'Sex', 'Age', 'SibSp', 'Parch', 'Fare', 'Embarked']
else:
clean_data = ['Pclass', 'Sex', 'Age', 'SibSp', 'Parch', 'Fare', 'Embarked']
return titanic[clean_data]
Now with our data cleaned, we need to import the package that contains the Random Forest algorithm, clean our data, and fit our data:
from sklearn.ensemble import RandomForestClassifier
data= clean_titanic(training,True)
# create Random Forest model that builds 100 decision trees
forest = RandomForestClassifier(n_estimators=100)
X = data.ix[:, 1:]
y = data.ix[:, 0]
forest = forest.fit(X, y)
So ‘forest’ is now holding our fitted model using the training data, before we move on and test this model on new data, we should first see how it performs in sample, to make sure everything went decently smoothly.
output = forest.predict(X)
When we compare these predictions to the actual observed outcomes, we are correct with 98% accuracy.
When we use this on our test data set, which Kaggle provides, it scores around 75%, which is about mid-pack on the leaderboard. By the way, doing a logistic regression with this exact data scores about 2 percentage points higher.
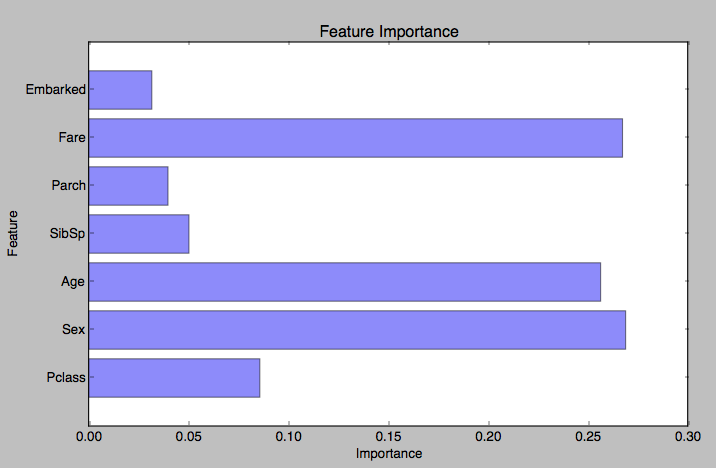
We can also see which variable is most important to the data set. How this is calculated is pretty simple. The importance of the j’th feature is calculated by calculating the Out-of-Bag (OOB) error, which is the prediction error without including that feature in the decision trees and comparing this to the error when the feature is included. Obviously, the bigger this difference, the more important the j’th feature is to accurately predicting, let’s take a look at which variables are most important in our data set:

Not surprisingly, we see that Fare, Age, and Gender are the most important features we have in our data that help determine whether or not somebody survived.
Here is the code for the graph:
import matplotlib.pyplot as plt

# first convert from panda DataFrame to python list
for column in data:
vars.append(column)
vars = vars[1:]
print(vars)
imps = []
for imp in importance:
imps.append(imp)
print(imps)
y_pos = np.arange(len(vars))

plt.barh(y_pos, imps, align='center', alpha=0.5)
plt.yticks(y_pos, vars)
plt.ylabel('Feature')
plt.xlabel('Importance')
plt.title('Feature Importance')
plt.show()
Okay, so that was our introduction to Random Forests, we are able to predict whether or not somebody survives the sinking of the titanic with 75% accuracy. Note there is still a lot that can be improved and tinkered here, I basically threw away half of the data set because they were strings.
