It is a saying that has stood the test of time: drive for show, putt for dough. But how much truth is there to this?
Mark Broadie’s work has shown convincingly that it is the long game that differentiates players over longer periods of time (i.e. a season, or more). Using data from 2003-2010, he shows that the variance in average total strokes-gained can be decomposed into 72% due to long game, 11% short-game, and 17% putting (see here, pg. 23). Again, to emphasize the point, Broadie is using these numbers to show what distinguishes golfers over the long-term. Let’s dig a bit further into this.
Despite these definitive results, there is still very much an ongoing debate about whether putting or long-game matters more. I think part of the confusion stems from the fact that there a couple different ways we could define the “importance” of any given part of the game, and they may lead us towards very different answers. First, we can talk about which parts of the game are most important over the course of an entire season (as Broadie’s analysis did), or we can talk about which parts of the game are most important in any given week.
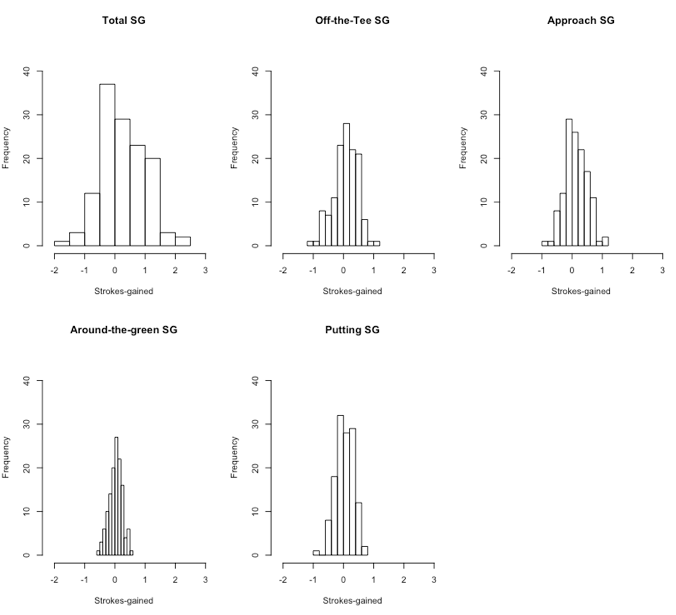
First, I’ll repeat Broadie’s analysis with the 2017 data. He did what is known as a variance decomposition. In simple terms, what we are doing is the following: we observe a spread in scoring averages over the course of a season (e.g. DJ gained 2 strokes per round on the field, Jason Day only gained 1 stroke per round, Steven Bowditch lost 1 stroke per round, etc.). We want to figure out which parts of the game contributed most to these differences in scoring averages between players. We do this by looking at the spread of players’ strokes-gained averages for the year in each category. Take a look at these histograms:

The x-axis scales are all identical, so we can compare across graphs easily. The intuition is simple (ignoring some statistical details): the more spread out a strokes-gained category’s histogram is, the more it matters for determining who the best players are over the course of a season. So you can see that around-the-green play has a very small spread, putting has a slightly larger spread, and then off-the-tee play and approach play are wider still. Here are the actual numbers of the variance decomposition of total strokes-gained averages in 2017 (they are similar to what Broadie’s analysis found):
- SG off-the-tee: 37%
- SG approach: 33%
- SG around-the-green: 10%
- SG putting: 20%
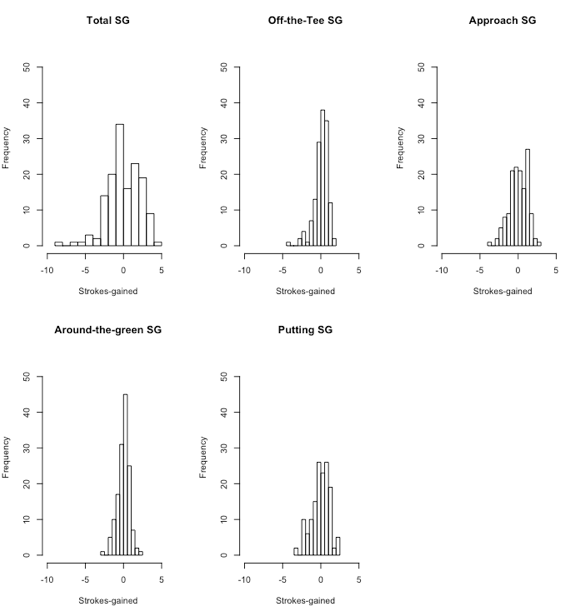
However, when we examine a specific week of play (I use data from the 2017 WGC-Bridgestone, but all weeks look pretty similar) we get a somewhat different story about which strokes-gained categories matter most. Consider this set of histograms, which plots all players’ strokes-gained per round for the week:

Again, we see that around-the-green SG is not separating players much. However, we see that the SG putting histogram is now a little shorter and wider than before when we were using year-long averages. The actual numbers for the variance decomposition at WGC-Bridgestone Championship were:
- SG off-the-tee: 15%
- SG approach: 33%
- SG around-the-green: 14%
- SG putting: 38%
So, we now see that putting is the SG category that separates players most in a given week (although it is still less important than the long game, which is off-the-tee + approach). I think there is a fairly simple way of understanding these two sets of results. On any given day, putting is pretty random; even the best putters can have pretty bad putting days, or weeks. On the flip-side, the best ball-strikers are typically the best at striking that ball week-in week-out. If you don’t believe me, which of the following bets would you rather take: 1) Betting that Lee Westwood will have a higher strokes-gained putting than Jordan Spieth in a single round, or 2) Betting that Brian Gay will have more strokes-gained off-the-tee than Rory McIlroy in a single round. In my opinion, ball-striking prowess is a much more reliable thing than putting prowess. As a result, we see that while putting doesn’t matter much over an entire year (people have good weeks and bad weeks that mostly balance out over the year to near-zero), it does matter a fair bit in any given week. An extreme example of this idea would be the following: each week, every player either gets hot and has +5 SG putting, or gets cold and has -5 SG putting. In the long-run, everybody’s SG putting will be zero (because whether you get hot or cold is just random) and so it will have no impact on what separates the best players over long time horizons, but it will have a huge impact week-to-week. This is what we observe in the data, but to a lesser extent.
Hopefully this provides some insight into the putting vs. ball-striking debate, which I’m sure will continue well into the future.
