Generally speaking, the further you hit the ball, the further off line you can hit it. A 300 yard shot that starts off 1 degree to the right will end up more distance from the target line than a 200 yard shot that starts off 1 degree right, all else equal. It is this basic notion that I am going to apply today to create a distance-adjusted measure of accuracy off the tee. Consider the following diagram:
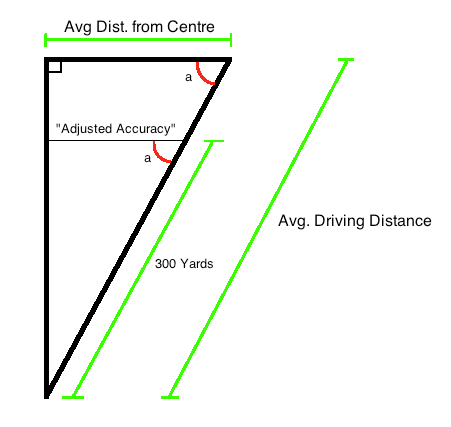
This diagram is drawn for a player with an average driving distance of more than 300 yards. The hypotenuse is the average driving distance of the player, and the horizontal line is his average distance from the center. Using basic trigonometry, I can obtain the angle “a”; the angle between a player’s average driving distance and their average distance from the center. Using that angle I can then calculate the distance of the line labelled “Adjusted Accuracy” – this will be the predicted number of yards from the center if the player’s average driving distance was 300 yards. So for players who hit it further than 300 yards, their Adjusted Accuracy will be less than their actual average distance from the center, while the converse is true for players who hit it shorter than 300 yards.
Clearly, I have made a big assumption here; I have assumed that average distance from the center is a linear function of the average driving distance. This is likely not true. However, for shots hit over 260 yards it may be a reasonable approximation. Also, notice that the slope is different for each player; it is determined by their average distance from the center and their average driving distance.
Note that choosing the normalized distance to be a 300 yard drive is irrelevant; what is going to determine the ranking of the players is the angle “a”. Once you have this, you can make the normalized distance any distance you would like. The absolute value of the Adjusted Accuracy measures will change, but the ranking of the players will be preserved.
I use 2015 Shot Link data to calculate player’s average distance from the center, and average driving distance, only using par 5 tee shots. I only want par 5 tee shots because I would like the players to be hitting drivers. To calculate the Adjusted Accuracy at 300 yards, I use the following formula:
\( Adjusted\_Accuracy = 300 \cdot [sin(90-(cos^{-1}(ADC/ADD))] \)
where ADC=Average Distance From Center, and ADD=Average Driving Distance. The unit used is yards.
The Adjusted Accuracy rankings for 2015 are shown below:
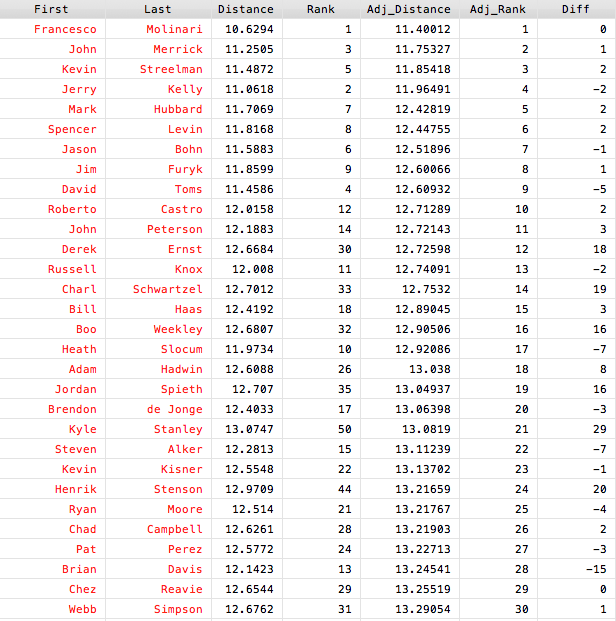
Here, “Distance” is the average distance from the center, “Adj_Distance” is the Adjusted Accuracy using 300 yards as the normalization, and “Diff” is the difference between a player’s ranking in the unadjusted versus the adjusted accuracy measures. It can be seen that there is not much movement at the top, which surprised me a bit.
Next, these tables give the biggest movers up the adjusted rankings and the biggest movers down the adjusted rankings, respectively:
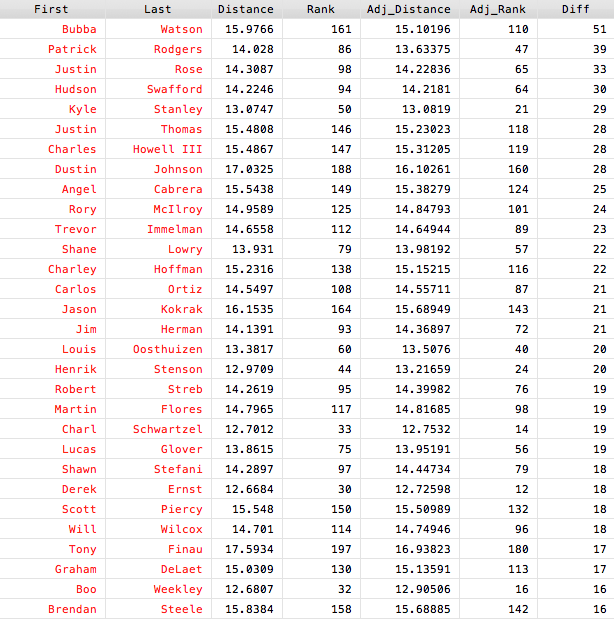
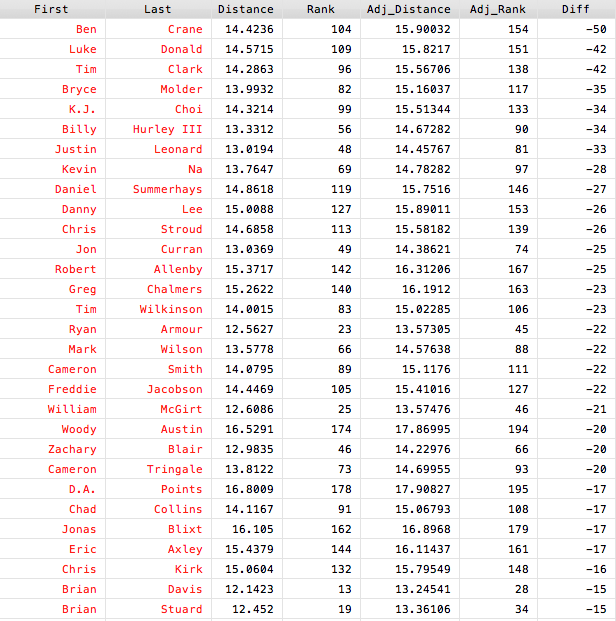
I honestly thought we might see Bubba move up even further, as I’ve always thought he drives it remarkably straight given his length. It can be seen that while the unadjusted and adjusted rankings are not drastically different, there is still a fair bit of movement between the two.
There are certainly other ways I could have tried to adjust for distance in measuring driving accuracy. However, this method is intuitive and computationally simple, which made it appealing. Leave a comment if you have thoughts on the usefulness of this statistic or ways through which it could be improved!
