A question that we often ask ourselves while we watch a player trample over a field on their way to victory is ‘can this guy ever lose if he plays his best?’
Well I am here to look into this question by comparing Tiger Woods, Jordan Spieth, and Rory McIlroy to each other during their ‘best year.’ For Tiger, I chose 2007, since he won about 45 times. For Jordan, I (obviously) chose 2015, where he won 2 majors and the FedEx Cup. Lastly, for our recently controversial Rory, I chose 2014, when he dismantled major fields with his Driving.
DRIVING
Okay, so first let’s look at driving stats during their ‘good’ years. The first plot is a distribution of drives for each player.
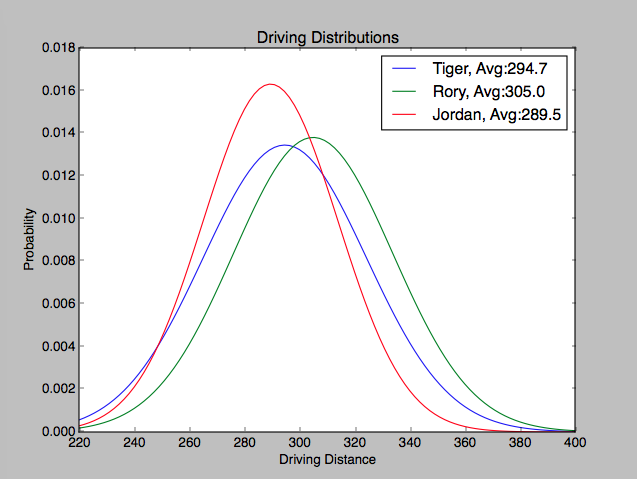
Not surprisingly, Rory’s curve is furthest to the right, meaning his driving average of 305 yards is the longest among the 3. Next is Tig, who averaged 295 off the tee. Last is Baby Spieth, at 289 yards. Also interesting is the shape of the curve. Tiger and Rory have a larger standard deviation, which means their drives had more variation in distances. This perhaps indicates that Tiger and Rory hit a larger variety of clubs off the tee, or perhaps that they each have an ‘extra gear’ with their driver. Jordan has a much narrow curve, indicating a smaller standard deviation. Since he hits it shorter it is not surprising he doesn’t have a lot of variation off the tee in terms of distance.
Of course we cannot just look at distance, we also need to look at accuracy. Unfortunately, way back in 2007, they did not as much data, so I can only compare fairways hit data. I would have liked to look at distance from middle, but what the hell..here is the data below:
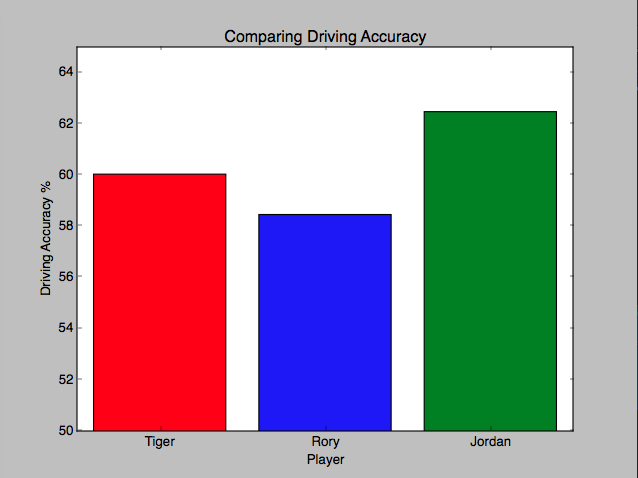
It looks like we would expect. Rory, who had the longest driving average, has lowest accuracy. Conversely, Jordo is the most accurate. Worth noting that there is actually not much variation here, I had to zoom in to make the graph look interesting. Only 4% separates Jordan and Rory, which is about 0.5 fairways a round. So while Jordan gives up 15 yards on average, he only makes up for it by hitting 0.5 fairways more each round. And Tiger is sitting in the middle again.
From the data, it looks like Rors is the best driver of the ball. Not to mention, when he misses, it isn’t by much (unlike Tig). It would have been interesting to see how much Tiger misses by on average, but recall the data is not available back then. Nonetheless, Rory is pumping it 10 and 15 yards past the two others on average, and not losing that much in accuracy.
So this round goes to RORY!!
APPROACHES
Okay, approach shots. In my opinion, I think all these guys are among the greatest in terms of mid-long irons when they are on their games. Maybe include Phil in there as well. Below I simply plotted a bar graph which indicates the average distance from the pin each player hits it from a variety of yardages. Here it is:
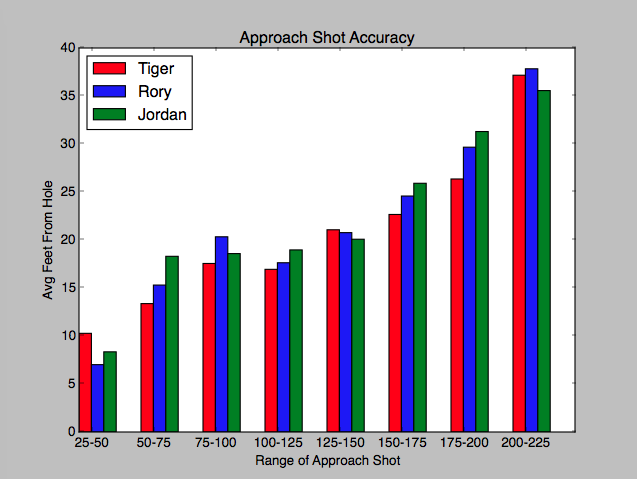
Oh boy, let’s see here. Tiger is the red (of course), he has the lowest distance to pin in 5 of the 8 categories. He really makes his hay from 150 to 200 yards, hitting it 4 – 5 feet closer ON AVERAGE than the other two. And his wedge game (50 – 100) is much more accurate than the other two. Jordan is the most accurate from 200-225 yards, but there probably isn’t much of a sample size there. Tiger is the worst from 25 – 50 yards, which is strange (maybe yips were always there). Look at this where it interests you and how you want, but the takeaway is that Tiger is a man among boys when it comes to hitting towering iron shots.
This round goes to…the TIG!!
PUTTING
Alright baby Jordan, let’s give you your bottle. Despite how great Tiger was/is on the greens, I do not expect him to challenge Jordan in this category. I did the same sort of analysis as for the approach shots, but for putting. Here it is:
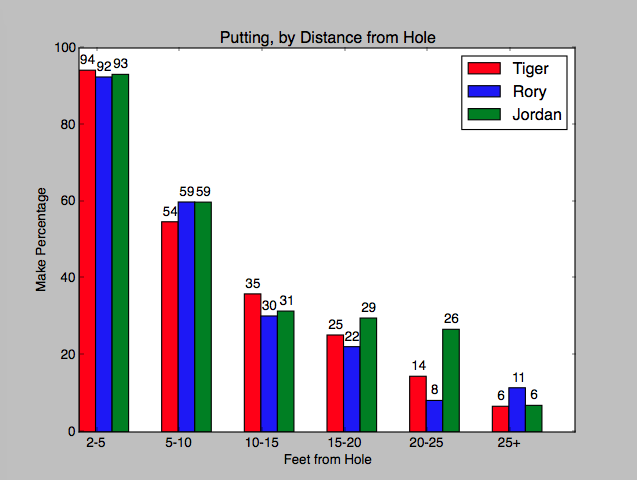
So from 2 – 5 feet, there is not much difference, thought Rory might be lacking here but no (this year (2016) would be different, remember this is 2014 Rory). From 5 – 10 feet, we see Tig fall off the pace a little bit, making 5% less of his putts than the other two. Tiger makes a statement from 10 – 15 feet, making 4% more than the others. After this, we see that those images of Jordan rolling in 20 footer on top of 2o footer does in fact translate to the data. He only makes 2% less of his putts from 15 – 20 feet than he does from 10 – 15 (is that good or bad..?). From 20 – 25 feet is just absurd, he makes 12% more than Tiger, and an astounding 18% more than Rory. Remember people, it is not uncommon to have putts from 15 – 25 feet, and he is lapping TIGER WOODS (the GOAT) here!
Alright Jordan…you got this round..

CONCLUSION
So who is better…I DON’T KNOW!
I ignored scrambling stats, would have liked to see approach shots from the rough or scrambling percentage. But the main categories of golf are well represented here. Something else to consider is that Tiger and Rory played much less than Spieth, so Jordan had access to ‘easier’ events probably. And very important to consider, because this is PGA Tour data, this does not include Augusta, US Open, or British (I think, definitely not Augusta). Can’t help but feel including Augusta would have helped Jordan’s case here.
They each won one category, and we don’t know which category is most important. Nobody is significantly lacking in any category, whatever Jordan is losing off the tee he appears to be making up for by raining in bombs on the greens, Rory wasn’t as bad at putting as I initially thought. Tiger wasn’t the worst in any category, and won one, unlike the other two, who each came last in a category. Tiger was definitely more superior to his peers than the others, but in terms of stats, it is not as clear he was any better.
The days of Tiger playing like shit and winning may be over if he comes back. According to these stats, he’ll have to play the lights out to win, which is the norm now.
Thanks to PGATour.com for the data..
