In the prime of his career, there was, and has never been, a more intimidating force on the golf course than Tiger Woods. Trying to win a golf tournament just seemed to become much more difficult playing alongside Tiger. This was in part due to Tiger always playing well, but also in part because players seemed to play worse than usual when in a Tiger pairing. Perhaps this was due to the larger crowds following and moving around constantly, or the pressure of having the G.O.A.T watching each shot, or having a front row seat to Tiger’s trademark fistpumps. Whatever the cause, players seemed to routinely play poorly alongside TW.
In this post, I try to quantify this apparent “Tiger effect”. For those of you who have read earlier posts, I use a similar approach here to that which was used to calculate our measure of “Strokes-Gained in Contention“. I consider all rounds that were played with Tiger on the weekend from 1997-2015. For each player, I calculate their baseline scoring average relative to the field using only weekend rounds played without Tiger in the group. Then, I calculate their relative to the field scoring average with Tiger for each year. Thus, for each player, in each year, I have the difference between their baseline weekend scoring average (which were calculated on a 3-year rolling basis) and their weekend scoring average with Tiger in the group.
This first figure plots the annual weighted average of these player-specific differences, where the weights are equal to the number of times a player plays with Tiger.
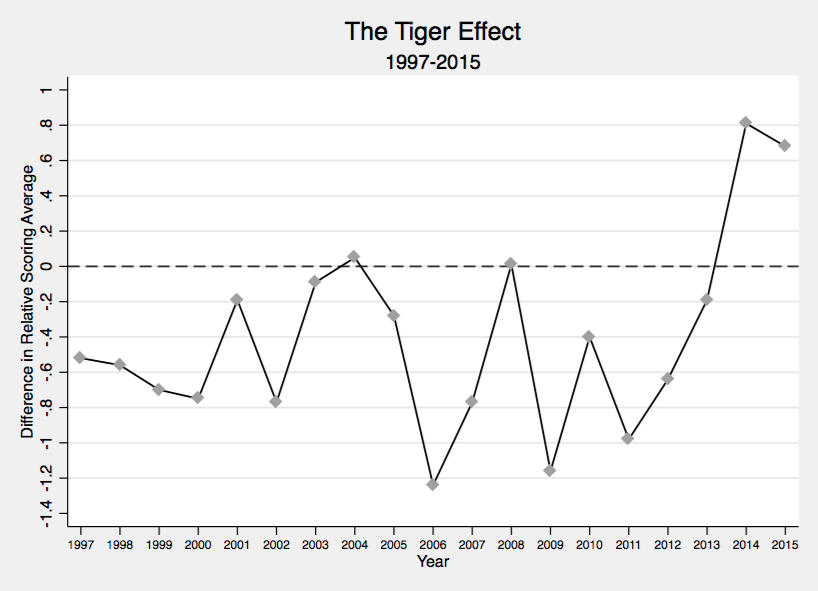
It can be seen that players played significantly worse, relative to their usual standard of play, when playing with Tiger in nearly all the years from 1997-2013. The largest “Tiger Effect” was in 2006, when players played a whopping 1.2 shots worse on average with Tiger in the group. That is astounding! It should be noted that the sample sizes in 2008, 2014, and 2015 are all quite small, as Tiger didn’t play many events those years. Taking a weighted average over the entire sample, we obtain a grand average “Tiger Effect” for 1997-2015 of -0.47. You could argue that the difference between the scoring average with Tiger and the scoring average without Tiger could reflect some differences apart from just the presence of Tiger; being paired with Tiger on the weekend means you are likely near the lead, and so perhaps this measure is capturing the general pressure effects of being near the lead. This is a fair criticism, but keep in mind the baseline scoring average is constructed using only weekend rounds as well, and as such it includes rounds where a player was near the lead (but was not playing with Tiger).
Next, I plot Tiger’s relative (to the field) scoring average for Saturday and Sunday rounds for 1997-2015.
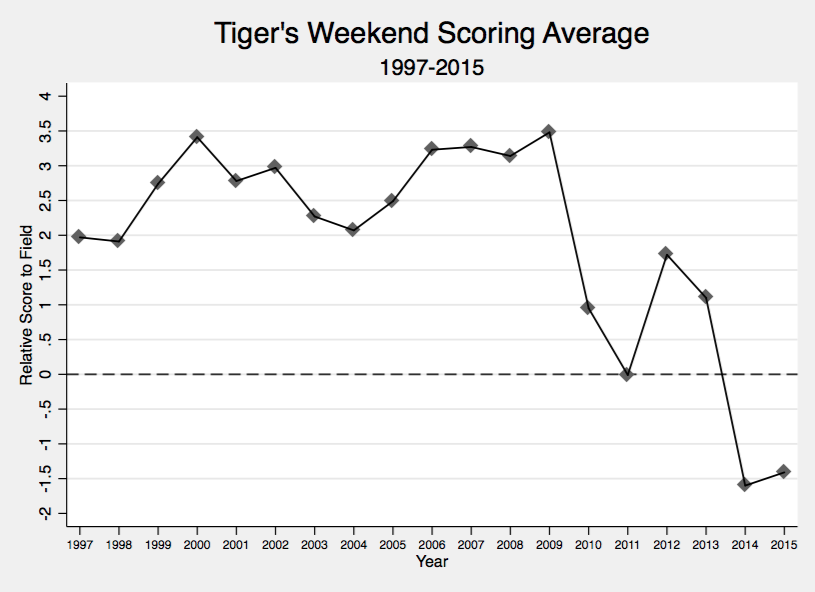
In addition to the precipitous dip that occurred in 2014, it is interesting to note that this plot is close to a mirror image of the previous plot; when Tiger is playing really well, his playing partners seem to play poorly, and vice versa.
Finally, I provide the player-specific “Tiger Effects” for players who have played with Tiger at least 5 times on the weekend from 1997-2015. (The data that I have used is pretty spotty before 2003; no majors are included, and even some regular events lacked tee time data).
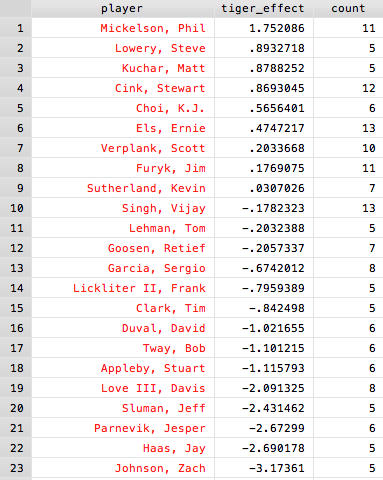
Atta boy Philly! At least he was playing well, on a personal level, while getting pummeled by Tiger on a regular basis. It also deserves to be noted that, while he didn’t make this table, Ian Poulter had the lowest “Tiger Effect” at -9.7 (a single round in 2011…).
Looking ahead to 2016 and beyond, we can only hope that Tiger regains his form, and the “Tiger Effect” returns with it.
To a degree might this be capturing the ability to ‘gear up’ and be more aggressive in shot choices (go4green, attacking pins, e.g.) to try to take or hold a lead. Interesting that Zach with his relative distance disadvantage and conservative play style is at the bottom?
Even if you have that ‘extra gear’ you still have to pull off the shots under pressure of being near lead with a big gallery, which Tiger did frequently. His ‘baseline’ game was so good, I think he could afford to be more conservative in shot choice than other players in early rounds. He was certainly more inured to the unique bubble of his gallery buzz and media attention than most players.
Tiger was usually lurking at or near the top so just the fact of being paired with him on the weekend increases the likelihood they are near the lead so maybe a mix of ‘lead pressure’ and ‘Tiger pressure’?