It’s been 8 weeks now since we started predicting PGA Tour events using our predictive model. Here we’ll look at how well the model has done in the 7 stroke play events we predicted to-date (we exclude the Match Play because that’s not what the model was made to predict). We’ve made predictions for 851 players with regards to their probability of winning, finishing in the top 5, finishing in the top 20, and making the cut. That gives us 851*4 = 3404 predictions to evaluate.
Because our predictions are probabilistic, we need a lot of data points to properly evaluate their quality. If the model says some event should happen 10% of the time, then we (evidently) hope that it does in fact happen 10% of the time.
To evaluate the model, we group our predictions into different classes defined by the percentage assigned to it (ex: 0-2%, 2-4%, 4-6%, etc.) and the type of prediction (Win, Top 5, Top 20, Make Cut). For each class, we give the number of observations that fell into the relevant range (ex: win with probability 0-2%) and provide the percentage of those observations that were “correct” (ex: the player actually won).
We first use a 2% interval and then a 10% interval to define our prediction categories. The model evaluation using 10% intervals is shown below.
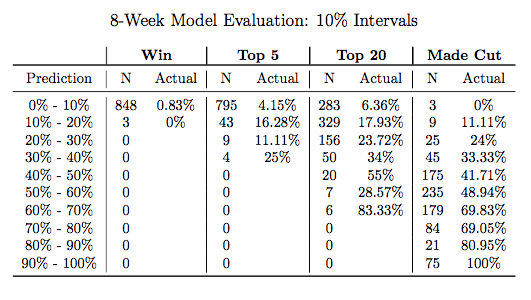
The 10% intervals are more appropriate when evaluating the cut predictions because they take on a bigger range. Conversely, the 2% intervals are more appropriate for evaluating the win predictions because they are nearly all less than 10%. You can look at the model evaluation using 2% intervals here.
To make sure you are interpreting the table correctly, let’s focus on a specific prediction class and walk through its interpretation. Let’s look at predictions for making the cut that were between 40-50%. So far, the model has given 175 players a probability between 40-50% of making the cut. And, so far, 41.7% of those players went on to actually make the cut. This is what we want to see: the actual cut percentage (41.7%) is inside the predicted range (40-50%) for the subset of players in this prediction category. For this exercise to be fruitful, we do need a lot of observations (I would say minimum 100) to really gain some insight into the model’s performance. It is a bit concerning that some of the actual cut probabilities (with a reasonably large N) fall outside their predicted range. We have been a bit lazy in the model simulations in deciding how to define the cut (in our model there are no ties, so we typically let 75-77 players make the cut in each simulation), so perhaps this is a sign we should make that a little more rigorous.
In the other categories the model is, in general, doing pretty well. Please do look through the table with 2% intervals if you want a better look at how the model is performing with win and Top 5 predictions.