In our first attempt at evaluating the importance of course history in predicting golfer performance, we used golfers’ histories at the specific course(s) being played in the relevant week as a means to predict performance; aka, the “Luke Donald at Harbour Town effect”. While we will briefly review the main result from that article, we recommend you read it in its entirety here.
The article, in a nutshell, was this: we calculated how much better a player performed historically at a specific course than their form at the time indicated (we termed this their “residual score”, where a (+) value indicated good play), and then used that to predict performance in the present week. The main graph from that article is shown below. Players in the bottom right of the graph are those with good course history who performed poorly in the relevant week, while those in the top right are those with good course history who performed well. The two remaining quadrants would be defined analogously. Both variables are in units of strokes / round (and positive means better performance).
 Notes: Historical course-specific averages are calculated from 2010 up to year of interest. Dependent variable is current week’s average score. All scores have been adjusted for a player’s current form (i.e. they reflect how much better or worse a player performed than expected). Regression is using data from 2015-2017; sample is restricted to those with at least 15 rounds in their course history.
The slope of the regression line is ~0.1, meaning that having a historical average at a specific course that is one stroke better per round results in a 0.1 stroke increase in expected score per round that week. While the magnitude of this coefficient is meaningful (margins are very small between professional golfers), the explanatory power of course history is very low. This is captured by the tiny R-squared (~0.2%). To put this number in context, we are able to explain about 15% of the variation in scores (that have already been stripped of any course difficulty differences) simply using a weighted average of historical scoring averages (again, we suggest you read the initial article for a more thorough explanation).
Following this initial article, we received some suggestions about other course-player variables that might be interesting to look at. One of those suggestions was to examine the predictive power of “course fit” (i.e. courses with similar characteristics). Therefore, because it is easy to measure and there are logical reasons for a predictive relationship to exist, here we focus on a single course characteristic: length. That is, we ask the question, “does a golfer’s past performance at long (short) courses predict future performance at long (short) courses?“
Grouping courses by length makes sense for a couple reasons. Firstly, as was eluded to, there are obvious reasons why certain players would perform better at longer courses than shorter ones. At longer courses, players with length are able to come into greens with mid or short irons, while players without are using woods or long irons. These two types of players can almost be thought of as playing different courses. This is in contrast to shorter courses, where, while still an advantage, a player’s length may not play as large a role (e.g. at some shorter courses driver may be taken out of the hands of longer players, and everybody ends up hitting approaches into the greens from similar spots). Secondly, as it relates to our prediction exercise, we are providing ourselves with a larger sample size to construct histories to predict with. Whereas before we were predicting using historical averages at specific courses, now we are predicting using historical averages at courses that share similar characteristics (namely, length), which gives us more data to work with.
Before getting to the graphs, a few details regarding the analysis. As with our first course history article, we are using “residual scores” to construct our historical averages. “Long” courses were defined as the longest 15% of courses (>7500 yards) and “Short” courses as the shortest 15% (<6950 yards). We were initially concerned that this cutoff would result in the inclusion of more tournaments from recent years in the long course analysis, as course length has steadily increased over time (right?!). However, between 2010 and 2017 the number of courses longer than 7500 yards has remained steady at 8-9 per year (in fact, it’s typically the same courses each year as well). We use round-level data from 2010 up to the relevant week to calculate golfers’ historical averages at long (or, short) courses, and predict performance using data from 2015-2017. For example, to predict Rory’s performance at the 2017 U.S. Open at Erin Hills, we are using his historical average at all “Long” courses from 2010 up to that date.
The two graphs below summarize the findings for “Long” courses. The graph on the left uses players with a minimum of 10 rounds to construct their historical average, while the graph on the right uses a minimum of 40 rounds (arbitrary cutoffs to be sure, but that’s why we are showing a couple different ones). The higher the minimum round requirement, the more indicative the historical averages will be of a player’s true ability at “Long” courses. We’ve also highlighted some notable players for your amusement. To interpret these graphs: the further right the dot is, the better that player’s history is at long courses, and the further up the dot is, the better that player performed in the week being predicted.
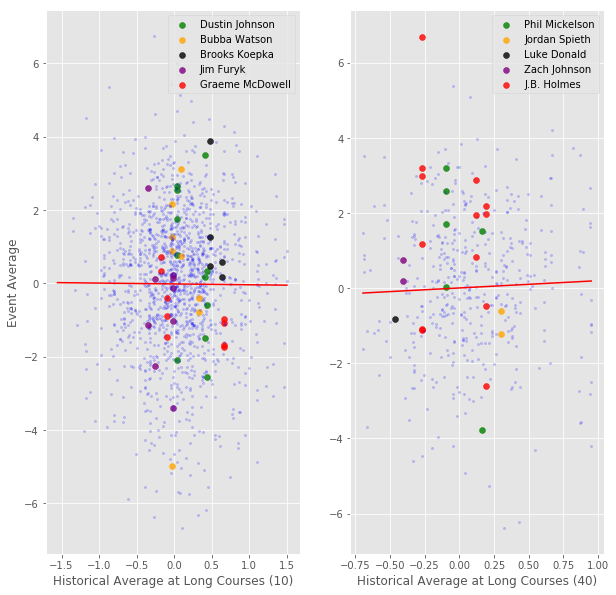
Notes: Historical averages are calculated from 2010 up to year of interest. Dependent variable is current week’s average score. A long course is any course greater than 7500 yards (longest 15% of courses). All scores have been adjusted for a player’s current form (i.e. they reflect how much better or worse a player performed than expected). Regression is using data from 2015-2017; sample is restricted to those with at least 10 rounds(left) and 40 rounds (right) in their course history.
The regression coefficient is -0.02 when using a minimum of 10 rounds in the player’s history (~1500 observations). As the number of historical rounds required to be in the sample increased (these graphs not shown), the slope of the regression line increased to a maximum of 0.19 using a minimum cutoff of 40 rounds in players’ histories (~500 observations). From both graphs you can see that this relationship is very noisy (the standard error on the estimate hovered around 0.1-0.2 using the various cutoffs). There are many players who have good histories at long courses, but perform poorly, and vice versa. Additionally, as with our course-specific plot in the previous article, the R-squared is very low, peaking at 0.2% using the 40-round cutoff. It’s worth mentioning what happens when we alter some of our arbitrary sample construction choices. One important arbitrary decision that was made (but by no means the only one) is the choice of what constitutes a “Long” course. We re-do the analysis using 7400 yards, and also 7450 yards, as the long course cutoff. Progressively restricting our sample from 10-round minimums to 40-round minimums, we see estimates rise steadily from -0.07 to 0.10 in the former case, and from 0.06 to 0.37 (!!) in the latter case. You may be surprised that such an arbitrary choice could matter so much, but unfortunately that is the nature of our (very noisy) data.
Alright, let’s stop and think a bit about this. First, the coefficient size was increasing in the minimum round cutoff. This is suggestive of their being a *true* course fit effect; the greater the sample of rounds used to construct a player’s course fit, the more predictive it is. However, secondly, notice how when we move from the 10-round cutoff to the 40-round cutoff the variance, or spread, in the historical long course averages shrinks (in the former, historical averages ranged from -1.5 to +1.5, while in the latter they ranged from -0.75 to +1.0). Therefore, even though the coefficient is larger with the 40-round cutoff, the maximum adjustment (using our largest estimate) we would make to a player’s expected score at long courses is 1.0 * 0.37 = 0.37 strokes / round (or -0.27 strokes / round at the other extreme). This also helps explain why the R-squared is still not very high despite the larger coefficient: there simply isn’t as much variance in the historical averages. If we could observe historical averages calculated from even larger samples, maybe we would see a further tightening of the distribution around zero. Or, perhaps it would level off and maintain a spread between -0.75 and 1.0; we don’t know. In general, I would take this piece of evidence as counter to the hypothesis of there being a *true course fit* effect. Third, let’s address the claim that we are being very restrictive by estimating just a *single course fit effect* for the entire population of golfers. Sure, it’s true this is restrictive: it may be that there are some golfers who respond more to course fit than others and we are not picking that up. But, what we are doing is still very informative. We (loosely speaking) have shown the average effect to be somewhere between 0 and 0.3 (depending on definition of long course and the minimum round cutoff). Therefore, if you are going to make the claim there are some players that respond strongly to course fit, than that implies you think there are other players that respond very weakly (or negatively!) to course fit. This is the implication because we know the average effect is near zero, so you can’t have big positives for some players without big negatives for others. Further, the standard error on this estimate is already large relative to the effect size; if you want to start estimating parameters for each player (or, by grouping players in some way) the noise will just overpower any signal you are trying to find. Of course, this doesn’t prove that a course fit effect doesn’t vary by specific players, but it does mean it’s a fool’s errand to try and identify it with data and statistical analysis (and yet.. here we are). Fourth, keep in mind that the larger estimates only apply to those players with at least 40 rounds in their “Long” course fit history. In a typical field, there will only be a handful of players with such a long history, so it not correct to apply that result to an entire field.
So, what’s the takeaway message here? The fact that the estimates moved so much by altering the arbitrary definition of a long course indicates we should be tentative in drawing any strong conclusions. While overall predictive power here is definitely very low, we do think the estimates obtained using a high round cutoff are meaningfully large and could be something that provides a slight edge to a predictive model. However, for players with a course fit that is based off a sample of less than 20-25 rounds, we just don’t see how you can separate the noise from any signal that could be there.
To conclude our analysis of long courses, here is an interactive plot showing the relationship between a player’s average residual score rank at long courses from 2010-2017 and the player’s average driving distance rank from 2010-2017.
Hover over the data points or use the dropdown to find specific players. Also note that these are rankings, so lower is better. The relationship is rough, but you do see that players who hit it longer do tend to perform better than their baselines at long courses.
Okay, on to the short courses (this will be brief). As with the long courses, we included the shortest 15% of courses in our regression, which corresponded to those under 7000 yards. Here is the plot using 15 rounds as a minimum cutoff with some notables highlighted.
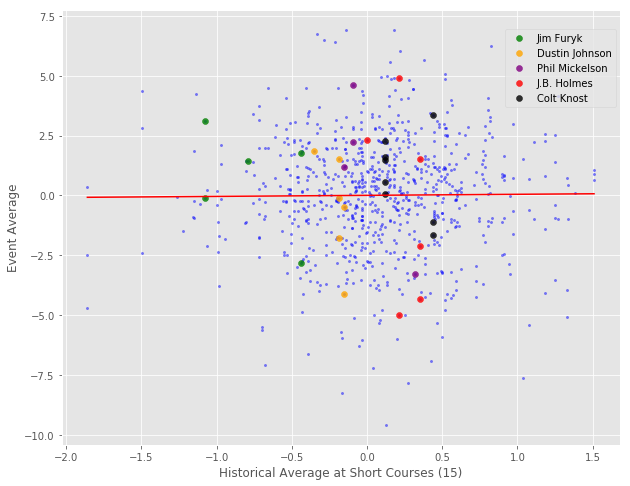
Notes: Historical averages are calculated from 2010 up to year of interest. Dependent variable is current week’s average score. A ‘short’ course is any course less than 7000 yards (shortest 15% of courses). All scores have been adjusted for a player’s current form (i.e. they reflect how much better or worse a player performed than expected). Regression is using data from 2015-2017; sample is restricted to those with at least 15 rounds in their course history.
In case you are only wearing one shoe and it’s not readily apparent, the slope of this line is very close to 0. Fiddling around with the minimum round cutoff, or with our definition of “Short” courses, caused big changes in the estimate (giving pretty large negative slopes in some cases). In short (pun intended), the short course analysis proved to be a noise mining expedition.
We don’t want to rationalize our findings (or lack of) too much after the fact, but we do have a couple thoughts as to why the short course exercise did not pan out. Firstly, the distribution of courses by total length is right-skewed, meaning that it is more bunched at the shorter yardages. Therefore, differences in course length are not that large in the bottom half of the distribution. This could result in courses we’ve designated as “Short” being not all that different from courses in the middle of the distribution. Secondly, it may be that the long courses in our analysis (e.g. Quail Hollow, Torrey Pines South, Congressional) are more similar in other respects than are the short courses (e.g. Pebble Beach, PGA West, Torrey Pines North). This point is probably a more general criticism of the entire approach here: perhaps length is too crude an instrument to classify courses into groups. However, as mentioned above, we chose length because it is an objective measure and there is some intuition behind why it could be predictive.
To conclude, this article examined whether historical performance at courses in a specific length range could predict future performances at these types of courses. In the long course sample, the data was very noisy, but there was a meaningful coefficient estimate using large histories (>40 rounds). Overall, there was very little predictive power. The short course analysis proved to be a frustrating exercise and there was no evidence of anything resembling a robust relationship. Both analyses were somewhat limited by the small number of observations. This is a more general problem with most analyses of player-course variables. For example, another suggestion we received after our initial article was to focus on *extreme* course histories (i.e. only those players who had very good or bad histories at specific courses). However, this restriction, in addition to some restriction on the minimum number of rounds played to construct the histories, simply leaves us with too few observations from which to draw meaningful conclusions or make any generalizations. (As an aside: for those astute statistical readers, you should know that there is no real reason to *focus* on the extreme values of the independent variable, because a regression including all the data is already weighting these observations the most.) Moving forward, we think a better analysis of course fit could be done by grouping courses together in a more comprehensive manner. It may be difficult to have a convincing result however given that some subjective decisions have to be made.