Using our predictive model we have been betting on the outcomes of PGA Tour events for 17 weeks (starting with the Genesis Open, and only skipping the team event in New Orleans and opposite fields events since). Other than a few bets at the start, we have focused on Top 20 bets. Our total return to-date is 151%! Here are some graphs that summarize how we are doing relative to some useful benchmarks.
This first graph shows 300 simulations of the profit path for 17 weeks (and 147 bets) using the adjusted implied probabilities as *truth* for each simulation. By adjusted implied probabilities, I mean the probabilities you obtain by normalizing the implied (or, “breakeven”) probabilities to 1. In a simple example of picking one of two teams (A and B) to win, if A has implied odds of 64%, and B has implied odds of 40%, then the adjusted implied odds will be 61.5% for A and 38.5% for B.
Continuing with this example, to simulate I let A win with probability 61.5% (in practice, this is achieved by drawing a number between 0 and 1 at random, and if it is less than 0.615, A wins) and I use the listed payouts to calculate simulated profit. Here is the graph:
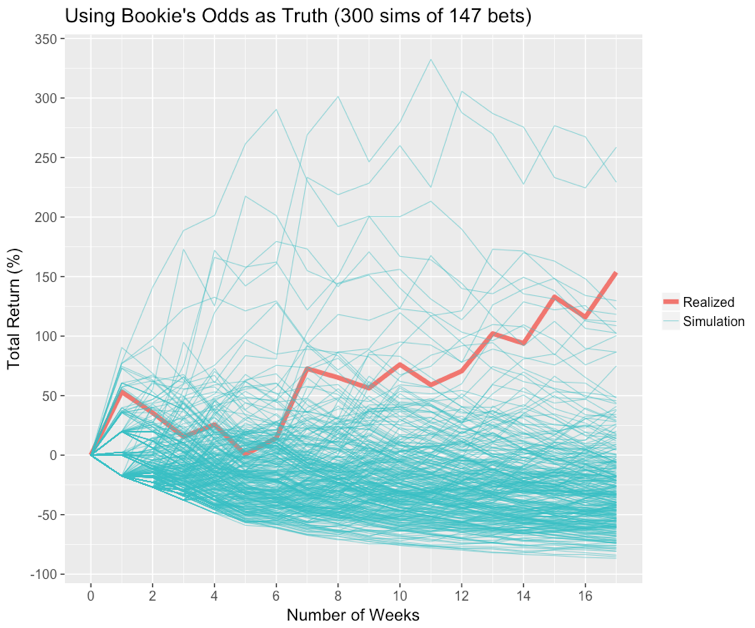
The returns are compounded each week. I have also included our realized return on the graph. (Note: for the following numbers, I performed 4000 simulations – I didn’t plot 4000 because it gets messy). Only 0.8% of the simulations performed better than our current returns in the 17 week period. Because the bookie takes a cut (the “juice”) the average return is about -25% in these simulations. This indicates that it is unlikely that our current returns could have arisen in a world where the bookies probabilities are correct on the bets we have taken.
The next graph shows 300 simulations of the profit path through 17 weeks using the model probabilities as *truth* for each simulation:
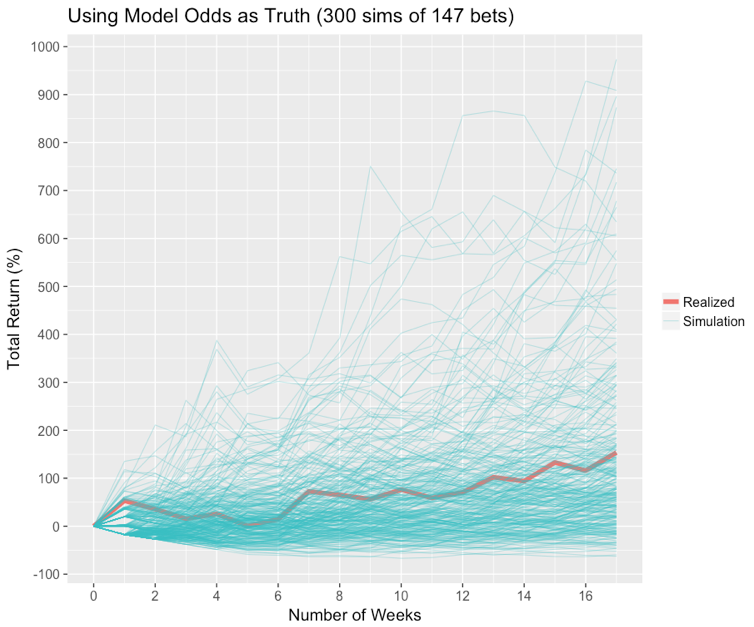
Here we see that our realized return is slightly above the average return in the simulations, indicating that, if the model is correct, we have been getting a bit lucky. (Again, the following numbers are based off 4000 simulations). The mean return in the simulations was 131%, and, interestingly, about 15% of the simulations had negative profits. This speaks to the wide variance in returns that are possible when making the types of bets we do (i.e. fairly low implied probabilities) and to the fact that 147 bets is still not a huge sample size.
Finally, here is a graph plotting the player-specific returns and investment sizes:
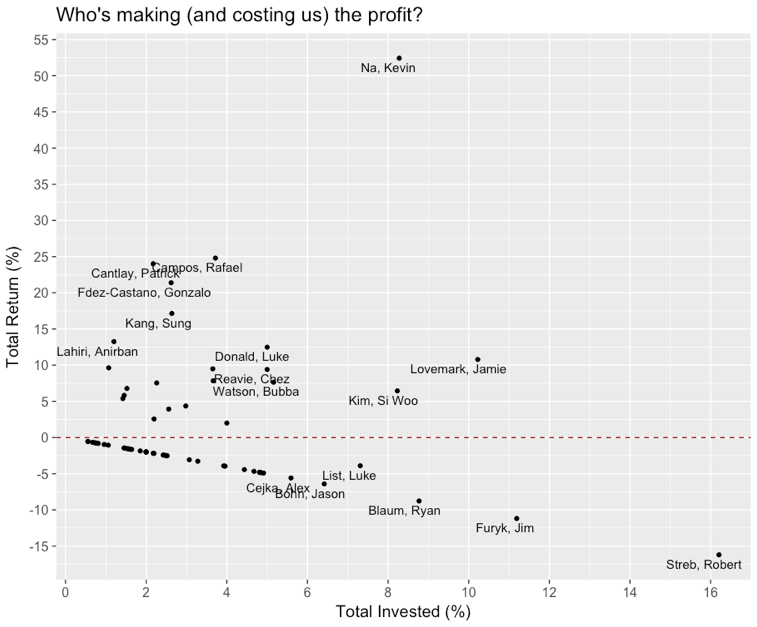
The model has loved Streb all year, unfortunately for us Streb has yet to finish in the Top 20 since we’ve started betting. Kevin Na’s large total return is mainly due to his Top 5 finish (our first and only Top 5 bet win) in the Genesis Open – our first betting week!